TOPIC 7.9 · STUDY
Phylogeny
Phylogenetic trees and cladograms are testable hypotheses of evolutionary relationship. Trees calibrated with fossils or a molecular clock show the amount of change over time. Cladograms show branching without that scale. Shared derived characters build the groups, the out-group is the least related lineage in the diagram, and a node is the most recent common ancestor of the lineages that split there.
7.9.A
Characters, out-groups, and calibration
Phylogenetic trees and cladograms show hypothetical evolutionary relationships. Those hypotheses can be tested with further evidence. A phylogenetic tree shows the amount of change over time, calibrated by fossils or a molecular clock. A cladogram shows the branching pattern without a time scale and without a measure of how much the groups differ.
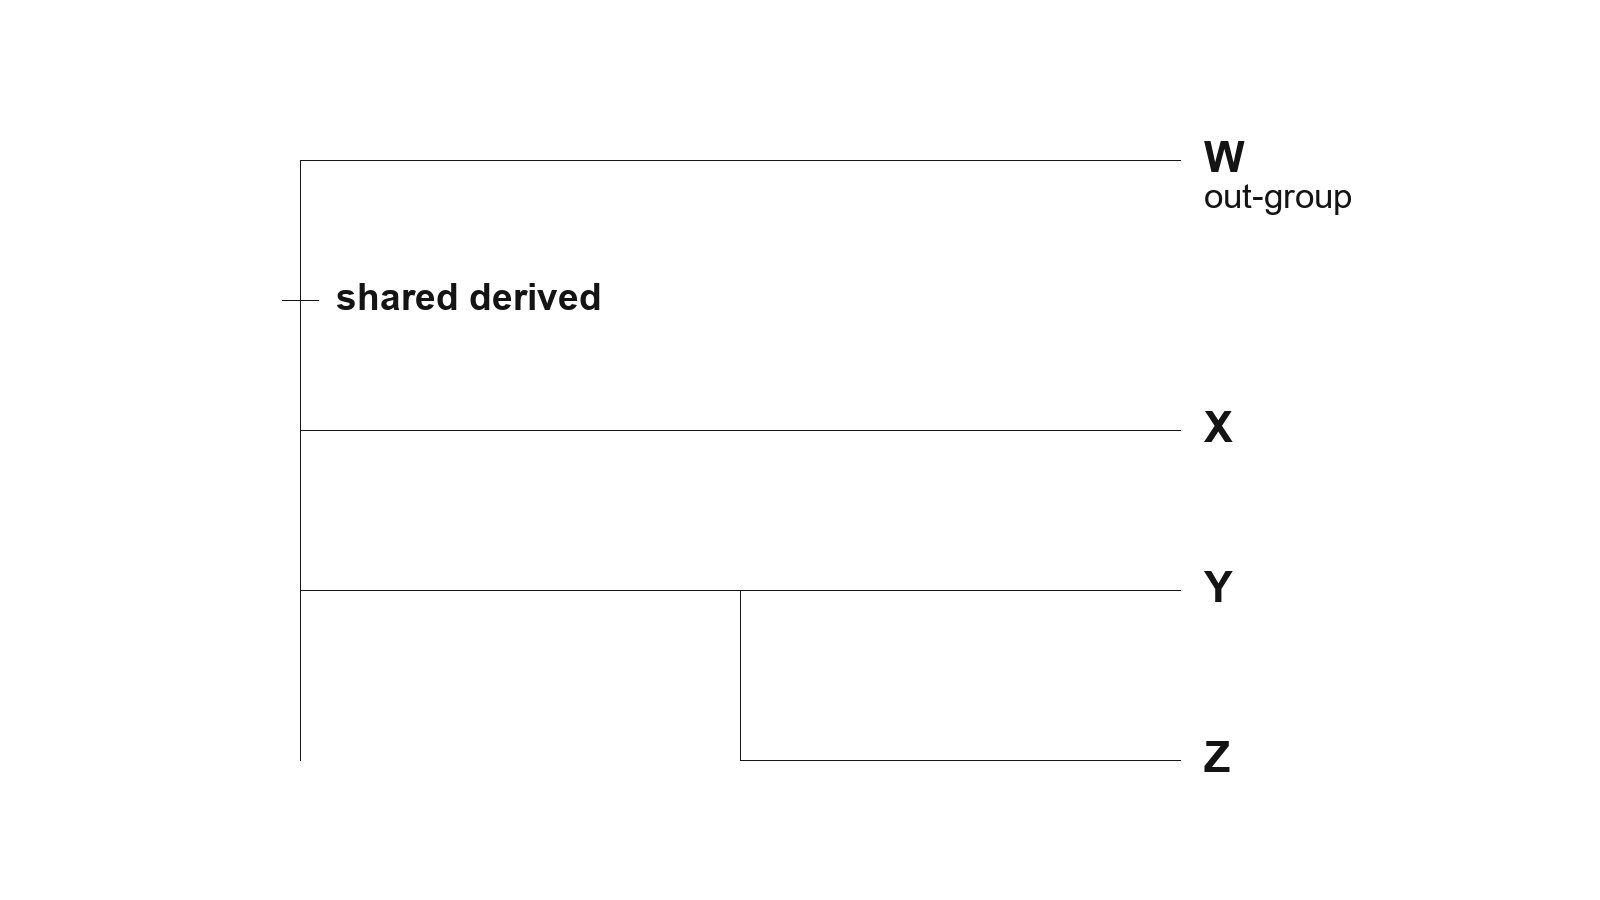
W branches off before the mark, so the mark is a shared derived character of X, Y, and Z. Y and Z share a more recent node than either shares with X.
Traits gained or lost during evolution are the characters used to build the diagram. A shared derived character can be present in more than one lineage. It indicates common ancestry and is informative for grouping. In the figure, the mark lies on the stem that leads to X, Y, and Z and not on the branch to W. A trait found only at one tip, or an ancestral trait that the out-group also has, does not by itself define that group.
The out-group is the lineage least closely related to the remainder of the organisms in the tree or cladogram. It is the comparison used to decide which state is derived. Molecular data typically provide more accurate and reliable evidence than morphological traits, because sequence characters are numerous. Morphology of living or fossil species is still valid evidence. When the two conflict, sequence data are usually the stronger guide. New evidence can move a branch, because the diagram is an inference.
| Diagram | What it shows |
|---|---|
| Phylogenetic tree | Amount of change over time, calibrated by fossils or a molecular clock |
| Cladogram | Branching pattern only, with no time scale and no amount of difference |
7.9.B
Nodes, ancestors, and revision
Trees and cladograms can illustrate speciation that has occurred. A split into separate lineages is drawn as branching. The node is the most recent common ancestor of the lineages that descend from that point. In the figure, Y and Z meet at a node that does not include X, so Y and Z share a more recent common ancestor with each other than either shares with X. W, the out-group, shares an even older split with all three.
The diagrams can be built from morphological similarities of living or fossil species and from DNA and protein sequence similarities. Shared derived morphological traits and shared derived sequence changes can support the same branching order. The drawing is a hypothesis that is revised when a new fossil or a new sequence appears. It is not a direct picture of the ancestor.
Key points
- Trees and cladograms are hypotheses of relationship and can be tested.
- A calibrated tree shows amount of change over time. A cladogram does not show that scale.
- Fossils or a molecular clock calibrate a tree.
- Shared derived characters group lineages. Gains and losses both count as characters.
- The out-group is the lineage least closely related to the others in the diagram.
- Molecular data are typically more accurate and reliable than morphology alone.
- A node is the most recent common ancestor of the lineages that split from it.
The out-group is not equally related to every tip. It is the first branch used to polarize which traits are derived.