TOPIC 8.3 · STUDY
Population Ecology
A population is the individuals of one species interacting with one another and with the environment. Its growth depends on the birth rate, the death rate, and its size. Without limits, growth is exponential: the rate of change equals the maximum per capita growth rate times the population size.
8.3.A
Population growth
A population is the members of one species in a place, affecting one another and affected by the surroundings. It is not every species in a community, and it is not a biome. Many adaptations are about getting energy and matter in that place. Those adaptations change how many individuals are born and how many die, so they change growth.
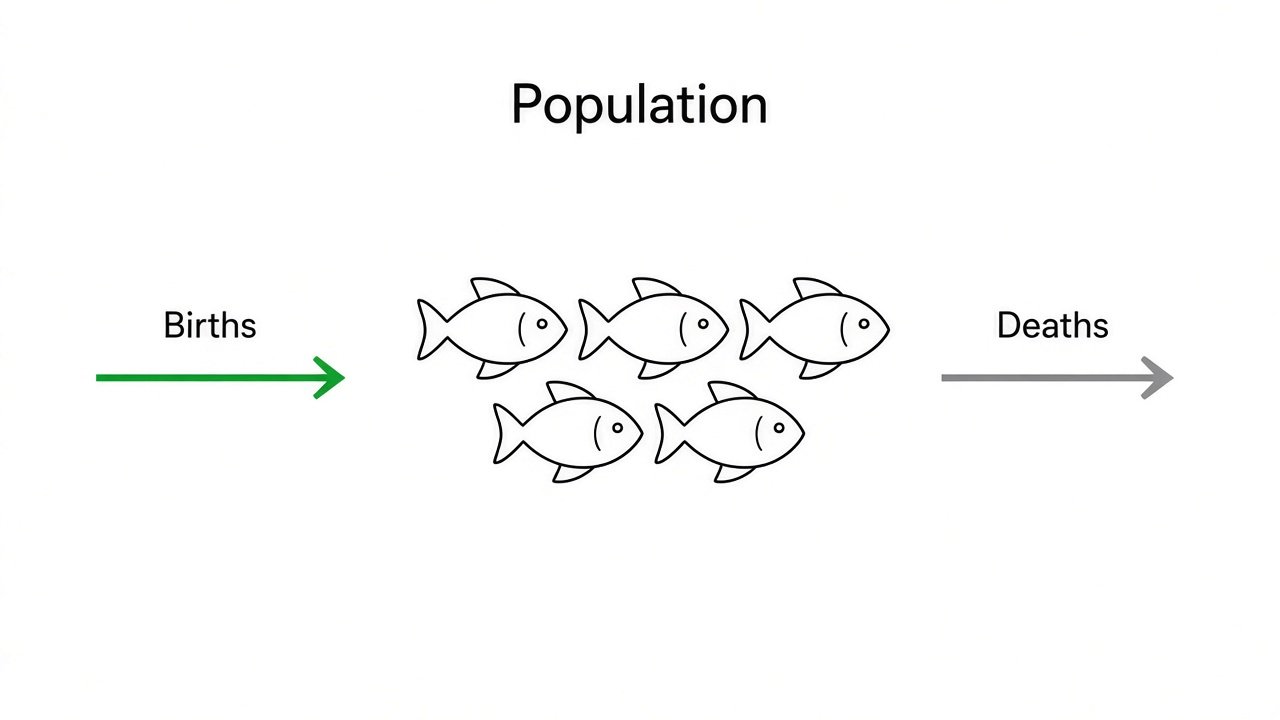
Births add individuals. Deaths remove them. The difference is the change in population size.
The course writes that change as $\frac{dN}{dt}=B-D$. Here $N$ is population size, $t$ is time, $B$ is the birth rate, and $D$ is the death rate. The two rates must share a time unit. If $B=48$ individuals per year and $D=30$ individuals per year, then $\frac{dN}{dt}=18$ individuals per year, so the population is growing. If $B=D$, then $\frac{dN}{dt}=0$ on that interval. If deaths exceed births, $\frac{dN}{dt}$ is negative and $N$ falls. Raising $D$ while $B$ stays fixed lowers $\frac{dN}{dt}$.
Reproduction without limits is exponential: $\frac{dN}{dt}=r_{\max}N$, where $r_{\max}$ is the maximum per capita growth rate. The rate is proportional to $N$. If $r_{\max}=0.25$ per year and $N=400$, then $\frac{dN}{dt}=100$ individuals per year. Double $r_{\max}$ and keep $N$ the same, and $\frac{dN}{dt}$ doubles. If $r_{\max}$ stays positive and $N$ is larger, $\frac{dN}{dt}$ is larger, so a graph of $N$ versus time curves upward and gets steeper. It is not a straight line. This model has no resource limit. Carrying capacity is not in the equation.
A change over a whole interval is not the same quantity as the instantaneous rate. A population that goes from 200 to 250 has a percent change of $\frac{250-200}{200}\times 100\%=25\%$. A rise from 300 to 360 over two years is an average of 30 individuals per year. Use $B-D$ or $r_{\max}N$ when the problem gives those quantities. Use percent change when the question asks how large the change is relative to the starting size.
Key points
- A population is one species interacting with itself and with the environment.
- Population growth: $dN/dt=B-D$. Example: $48-30=18$ individuals per year.
- If $B=D$, size is not changing. If $D$ rises and $B$ does not, $dN/dt$ falls.
- Exponential growth: $dN/dt=r_{\max}N$. Example: $0.25\times 400=100$ individuals per year.
- With $r_{\max}>0$, a larger $N$ makes $dN/dt$ larger, so the curve gets steeper.
- Percent change compares the change with the starting size. It is not a substitute for $dN/dt$.
- The exponential model assumes reproduction without resource limits.
Exponential growth does not level off. Leveling near a resource limit is the logistic model, $\frac{dN}{dt}=r_{\max}N\frac{K-N}{K}$, in topic 8.4.